Weekly Forwards Availability
About
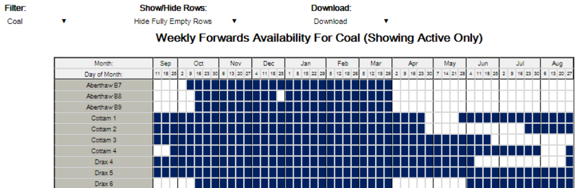
The weekly forwards availability heatmap uses UOU data to
show on a weekly level the availability at units across the next 52
weeks.
This is most useful for noting the future levels of outages
anticipated and can be used to learn more about the future
intentions of certain plants.
This can be seen with this example for coal stations taken in
early September 2017:
Included Data
The data on this heatmap is the 2-52 Week Unit Output Usable OC2 availability data
(the maximum expected daily availability) divided by the Generation
Capacity (the output of the unit at 100% availability). For wind farms this is based upon a forecasted output value.
Colours Guide
The following details the colours used in this chart:
| Styling |
Description |
|
Unavailable Unit |
|
0-10% Available |
|
10-20% Available |
|
20-30% Available |
|
30-40% Available |
|
40-50% Available |
|
50-60% Available |
|
60-70% Available |
|
70-80% Available |
|
80-90% Available |
|
90-100% Available |
Data Service
The Weekly Forwards Availability data can be extracted from
the API to extract percentage availability rates projected forwards
2-52 weeks with this being for a set time range and resolution
(weeks). The parameters used as follows:
| Code |
Required/Optional |
Description |
| chart |
Required |
uouweekly |
| format |
Required |
The type of format. The value could be xml or csv. (See 'formats' action)
|
|
Examples :
https://enbm.netareports.com/dataService?username=xxx&password=xxx&format=xml&action=data&chart=uouweekly
|
|