|
Help Files: |
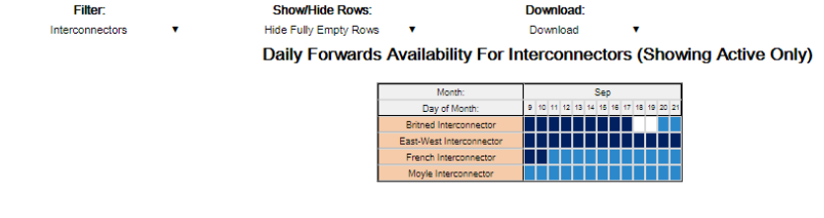
Daily Forwards AvailabilityAboutThe Daily Forwards Availability gives a view over the next 14 days of planned levels of max availability across the market, including at interconnectors. For instance the following screen shows that the French Interconnector will soon be at half capacity and that there is an outage coming up at the Britned Interconnector:
A summary of this 2-14 day availability data can be found along with a comparison against demand in the UOU Summary chart in the Power (Forecasting) collection of charts to get a better view of how these individual levels affect the overall over/under-supply dynamic of the market, along with a summary of the changes in these values day to day or forecast to forecast. Included DataThe data on this heatmap is the 2-14 Day Unit Output Usable OC2 availability data (the maximum expected daily availability) divided by the Generation Capacity (the output of the unit at 100% availability). For wind farms this is based upon a forecasted output value. Colours GuideThe following details the colours used in this chart:
Data ServiceThe Daily Forwards Availability data can be extracted from the API to extract percentage availability rates projected forwards 2-14 days with this being for a set time range and resolution (daily). The parameters used as follows:
|
|||||||||||||||||||||||||||||||||||||