System Margin
About
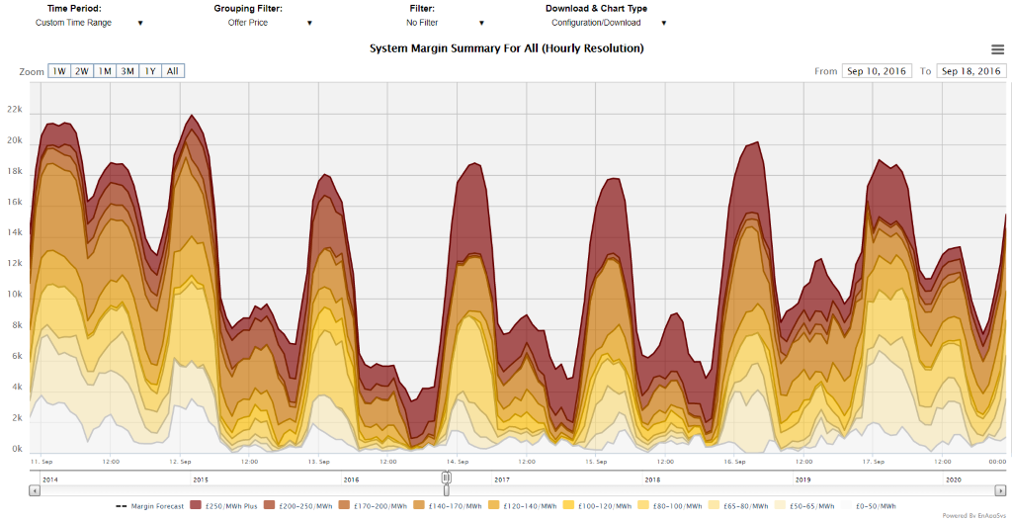
The System Margin Summary chart provides more information
about the margin between levels of generation and levels of
availability in the market. This is most valuable in showing – when
set to Offer Price and No Filter – the cost of margin in the market
over time.
Within this chart it is possible to view the full timespan
and then zoom in on activity of interest and this zooming can be
used to show the following period in which margin went very
expensive as the system tightened and as wind generation levels
declined. During this particular period Balancing Mechanism prices
peaked at £1,500/MWh:
Included Data
The data on this chart is the difference between the Max Export Limit availability
(the maximum level at which the BM Unit may be exporting to the
GB Transmission System at the Grid Supply Point)
data and the Expected Metered Volume (post-balancing generation) when this difference
is greater than zero. This is then aggregated across units in the market, with any data
from interconnectors, nuclear or wind farms being excluded.
Data Service
The System Margin Summary data can be extracted from the API
to get margin based upon a set of tags that can be extracted from
the browser URL of the System Margin Summary chart during normal
viewing. The parameters used as follows:
| Code |
Required/Optional |
Description |
| chart |
Required |
systemmarginoverall |
| startdatetime |
Required |
The start date time in format YYYYMMDDHHMMSS. |
| enddatetime |
Required |
The end date time in format YYYYMMDDHHMMSS. |
| resolution |
Required |
The type of resolution. (See 'resolutions' action, e.g.
hh) |
| series_to_plot |
Optional |
The groupings to break the margin down by, e.g. offerprice.
This defaults to fuel and is as in the browser URL when
picking options in the chart normally.
|
| filter |
Optional |
The group to show data for, e.g. filter=fuel&fuel=coal.
This defaults to no filter and is as in the browser URL when
picking options in the chart normally.
|
| format |
Required |
The type of format. The value could be xml or csv. (See 'formats' action)
|
|
Examples :
https://enbm.netareports.com/dataService?username=xxx&password=xxx&format=xml&action=data&chart=systemmarginoverall&startdatetime=20190520000000&enddatetime=20190527000000&resolution=hh&series_to_plot=offerprice&filter=fuel&fuel=coal
|
|