Availability Heatmap
About
The Availability Heatmap gives an overview of where units
have and haven't been available over time and this can be used to
see who was available in a given week, or it can be used to get a
more strategic view of the market.
Within this screen it is possible to Hide Fully Empty Rows to
reduce the amount of detail being shown and it is possible to
filter for one or a combination of different filter types.
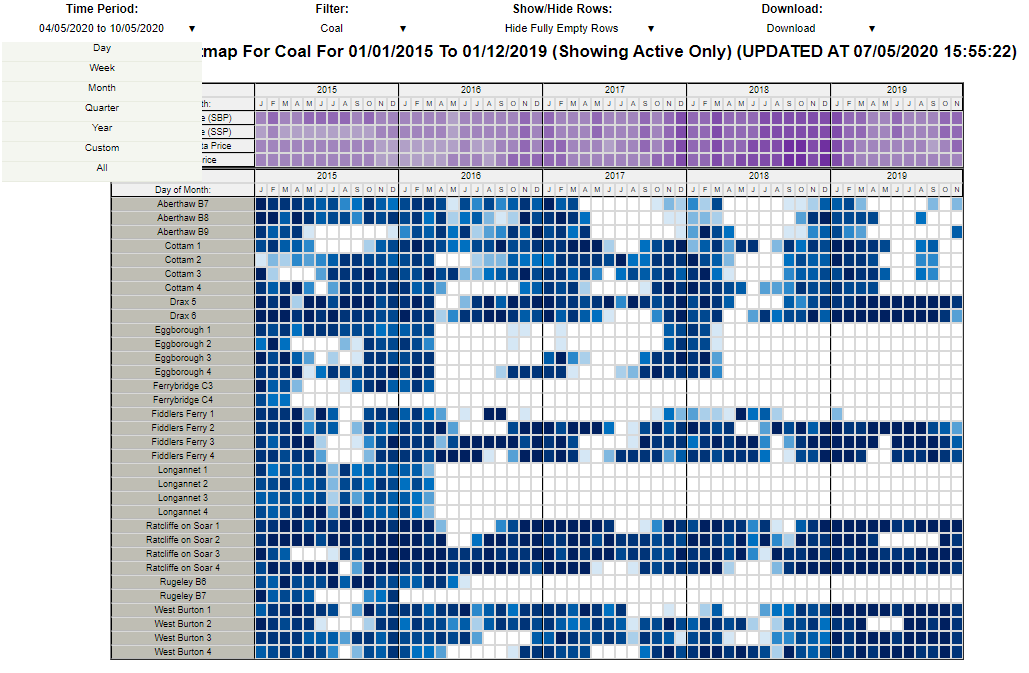
For instance, the following screen shows the levels of
availability in the market for coal stations through from 2014 to
November 2019:
The zones can be seen in the following map:

This shows where units were in outage and also shows plant
closures at Longannet for instance and the major change in approach
at Eggborough over the period.
Included Data
The data on this heatmap is the Max Export Limit availability data
(the maximum level at which the BM Unit may be exporting to the
GB Transmission System at the Grid Supply Point) divided by the Generation
Capacity (the output of the unit at 100% availability).
Colours Guide
The following details the colours used in this chart:
| Styling |
Description |
|
Unavailable Unit |
|
0-10% Available |
|
10-20% Available |
|
20-30% Available |
|
30-40% Available |
|
40-50% Available |
|
50-60% Available |
|
60-70% Available |
|
70-80% Available |
|
80-90% Available |
|
90-100% Available |
Data Service
The Availability Heatmap data can be extracted from the API
to extract percentage availability rates across all the listed
units over time. The parameters used as follows:
| Code |
Required/Optional |
Description |
| chart |
Required |
availhm |
| startdatetime |
Required |
The start date time in format YYYYMMDDHHMMSS. |
| enddatetime |
Required |
The end date time in format YYYYMMDDHHMMSS. |
| resolution |
Required |
The type of resolution. (See 'resolutions' action, e.g.
hh) |
| format |
Required |
The type of format. The value could be xml or csv. (See 'formats' action)
|
|
Examples :
https://enbm.netareports.com/dataService?username=xxx&password=xxx&format=xml&action=data&chart=availhm&startdatetime=20190213000000&enddatetime=20190214000000&resolution=hh
|
|