|
Help Files:
|
System Summary
About
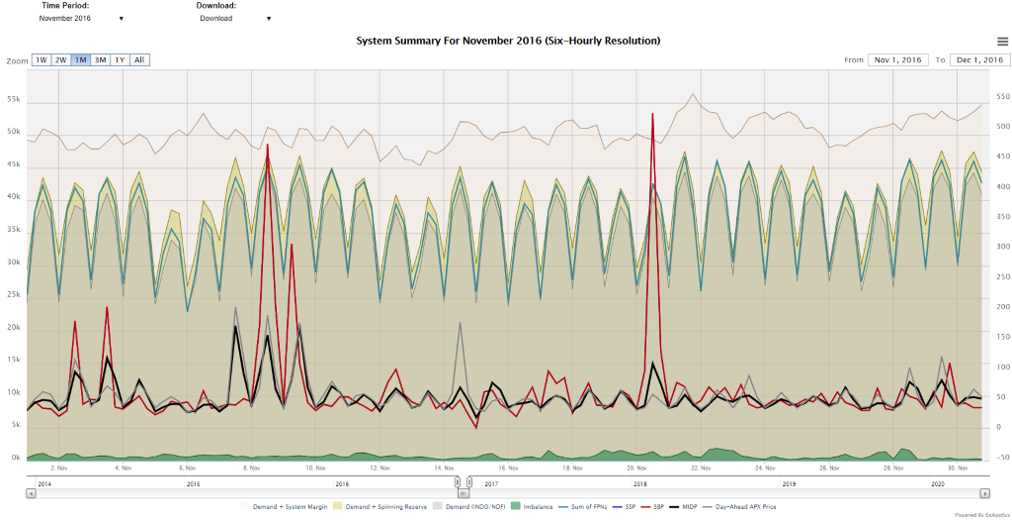
The System Summary chart produces a useful summary of the
market over a period of time and can be used to identify historical
periods of interest. This shows the evolution of all the key prices
in the market as well as levels of demand and margin.
Tight levels of demand and margin indicates high prices in the system:

Included Data
The data on this chart is as follows:
- Demand + System Margin - total system availability not taking into account the time required to
get certain units generating
- Demand + Spinning Reserve - total system availability taking into account the time required to
get certain units generating, using spare availability at already running units
- Demand (INDO/NDF) - Levels of demand based upon the initial demand outturn data and the forecast for this value (National Demand Forecast). This is INCLUDING transmission losses but EXCLUDING station transformer load, pumped storage demand and interconnector demand
- Imbalance - This is the sum of all noted
imbalance volumes at all units in the system and shows the level
of trips within the system. When high it indicates that a number
of units have trips and at such times prices can be affected by
this activity.
- Sum of FPNs - Plots levels of FPN generation as
summed across all units indicating how much generation was
expected across the system before adjustments were made via the
balancing mechanism.
- SSP - the system sell price (the price at which over-produced power must be sold at)
- SBP - the system buy price (the price at which under-produced power must be bought at)
- MIDP - the market index data price (the volume weighted average of the trades in the APX intraday auction within an 8 hour window ahead of delivery)
- Day-Ahead EPEX Price - the price for power in the 9:20am EPEX day ahead auction with results generally being published at 9:30am
- Day-Ahead Nordpool Price - the price for power in the 9:50am Nordpool day ahead auction with results generally being published at 10:00am
Data Service
The System Summary data can be extracted from the API to extract
the markets key system level data series. The parameters used as
follows:
| Code |
Required/Optional |
Description |
| chart |
Required |
systemsummary |
| startdatetime |
Required |
The start date time in format YYYYMMDDHHMMSS. |
| enddatetime |
Required |
The end date time in format YYYYMMDDHHMMSS. |
| resolution |
Required |
The type of resolution. (See 'resolutions' action) |
| format |
Required |
The type of format. The value could be xml or csv
. (See 'formats' action)
|
|
Example :
https://enbm.netareports.com/dataService?username=xxx&password=xxx&format=xml&action=data&chart=systemsummary&startdatetime=20180416000000&enddatetime=20180417000000&resolution=hh
|
|
