NIV Analysis
About
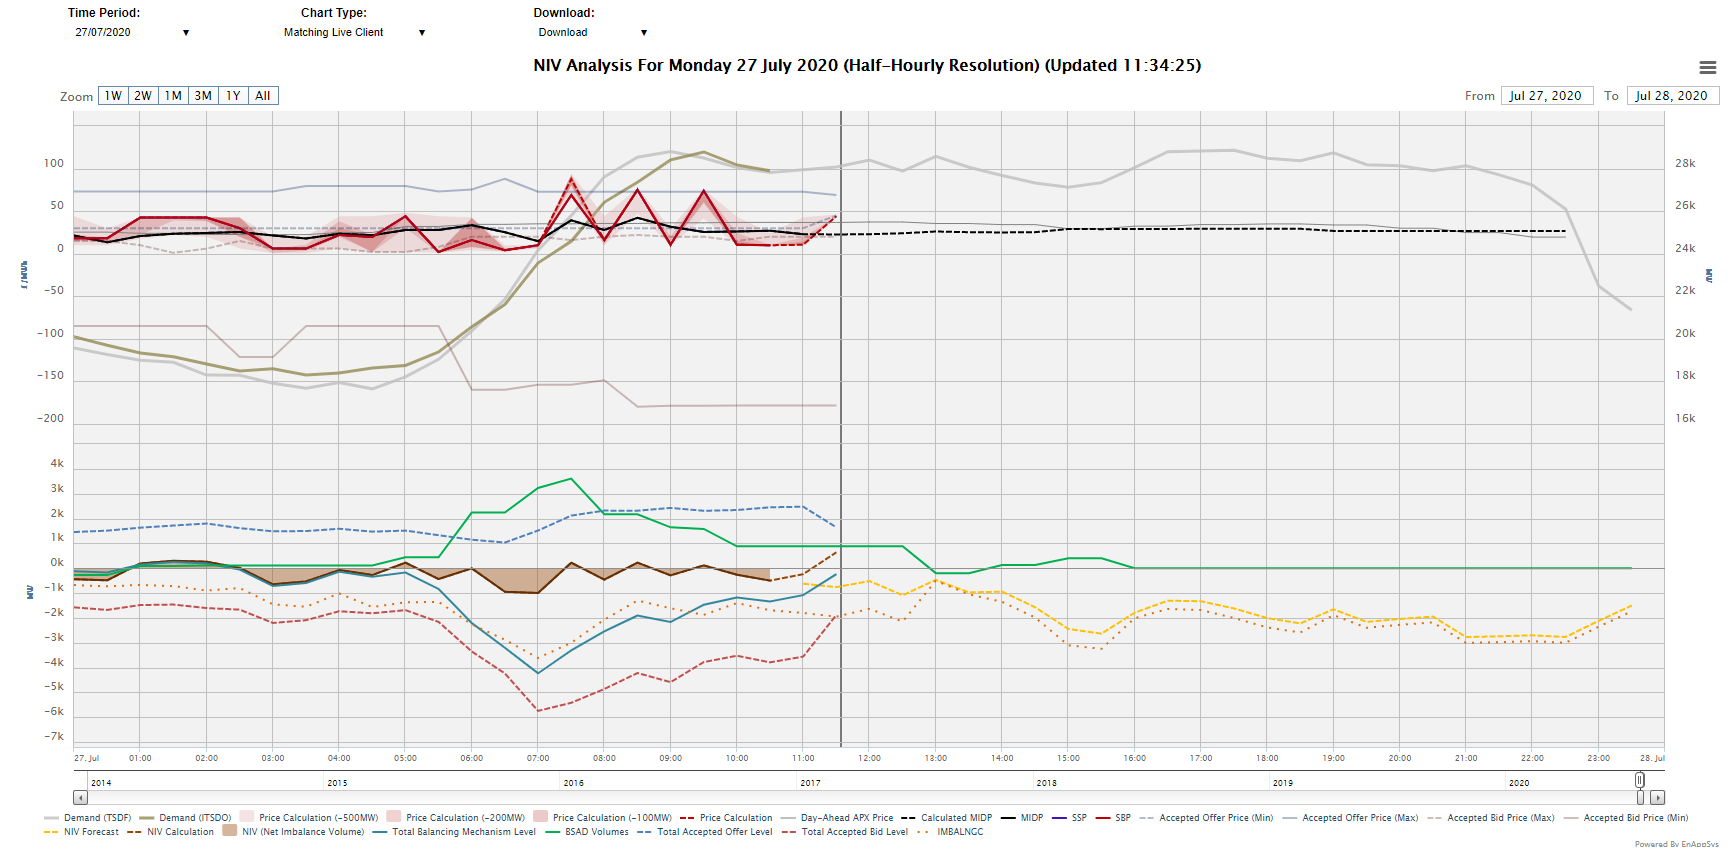
The NIV Analysis chart uses the IMBALNGC forecast provided by
National Grid (based upon difference between their forecast and the
submitted PNs and adjusts this for the most recently know error in
the market.
This is then plotted against data from EnAppSys’ realtime
calculation of system prices in the market to provide two different
views on the position of the Net Imbalance Volume going forwards:

This chart can be setup as columns or a lines view to match
the live client and the time period can be setup to track the NIV
(Net Imbalance Volume) series so that the view is always sat around
the ideal time range. The columns view is better for a small period and the
lines view is better for longer term analysis.
Included Data
The data on this chart is as follows:
- Demand (TSDF) - transmission system demand forecast (INCLUDES Interconnector flows and demand from station transformers and pumped storage units)
- Demand (ITSDO) - initial transmission system demand outturn values (INCLUDES Interconnector flows and demand from station transformers and pumped storage units)
- Price Calculation (500MW) - the price that would occur within the current price stack if the NIV position were to be moved by +/- 500MW without changing the acceptances in the stack
- Price Calculation (200MW) - the price that would occur within the current price stack if the NIV position were to be moved by +/- 200MW without changing the acceptances in the stack
- Price Calculation (100MW) - the price that would occur within the current price stack if the NIV position were to be moved by +/- 100MW without changing the acceptances in the stack
- Price Calculation - the system price based upon the current price stack (the currently accepted actions)
- Day-Ahead EPEX Price - the price for power in the 9:20am EPEX day ahead auction with results generally being published at 9:30am
- Day-Ahead Nordpool Price - the price for power in the 9:50am Nordpool day ahead auction with results generally being published at 10:00am
- Calculated MIDP - a calculation of the MIDP from the trades already completed in the APX intraday auction
- MIDP - the market index data price (the volume weighted average of the trades in the APX intraday auction within an 8 hour window ahead of delivery)
- SSP - the system sell price (the price at which over-produced power must be sold at)
- SBP - the system buy price (the price at which under-produced power must be bought at)
- Accepted Offer Price (Min) - the lowest offer price accepted in the price (a bound on the likely system price range if the system is short)
- Accepted Offer Price (Max) - the highest offer price accepted in the price (a bound on the likely system price range if the system is short)
- Accepted Bid Price (Max) - the highest offer price accepted in the price (a bound on the likely system price range if the system is long)
- Accepted Bid Price (Min) - the lowest offer price accepted in the price (a bound on the likely system price range if the system is long)
- NIV Forecast - a forecast of the NIV based upon the demand error, imbalance/trip error, the IMBALNGC and a correction for recent trends
- NIV Calculation - a calculation of the NIV based upon the already completed trades in the market
- NIV (Net Imbalance Volume) - the difference between supply and demand in any given period
- Total Balancing Mechanism Level - the net volume of actions accepted in the Balancing Mechanism
- BSAD Volumes - the net volume of actions taken by National Grid outside of the Balancing Mechanism
- Total Accepted Offer Level - the volume of offer volumes (upward actions) accepted in the Balancing Mechanism
- Total Accepted Bid Level - the volume of bid volumes (downward actions) accepted in the Balancing Mechanism
- IMBALNGC - the indicated imbalance forecast (the difference between the sum of the PNs submitted for generation BM Units (i.e. the Indicated Generation), and the National Demand Forecast)
Data Service
The NIV Analysis data can be extracted from the API to extract
the series used to forecast the Net Imbalance Volume. The parameters used as
follows:
| Code |
Required/Optional |
Description |
| chart |
Required |
nivanalysis |
| startdatetime |
Required |
The start date time in format YYYYMMDDHHMMSS. |
| enddatetime |
Required |
The end date time in format YYYYMMDDHHMMSS. |
| resolution |
Required |
The type of resolution. (See 'resolutions' action) |
| format |
Required |
The type of format. The value could be xml or csv
. (See 'formats' action)
|
|
Example :
https://enbm.netareports.com/dataService?username=xxx&password=xxx&format=xml&action=data&chart=nivanalysis&startdatetime=20180416000000&enddatetime=20180417000000&resolution=hh
|
|
