|
Help Files:
|
Boundary Flows
About
The Boundary Flows chart uses National Grid’s forecasted
levels of locational demand and levels of locational generation to
find zones where levels of generation might need to be reduced in
order to match up supply and demand.
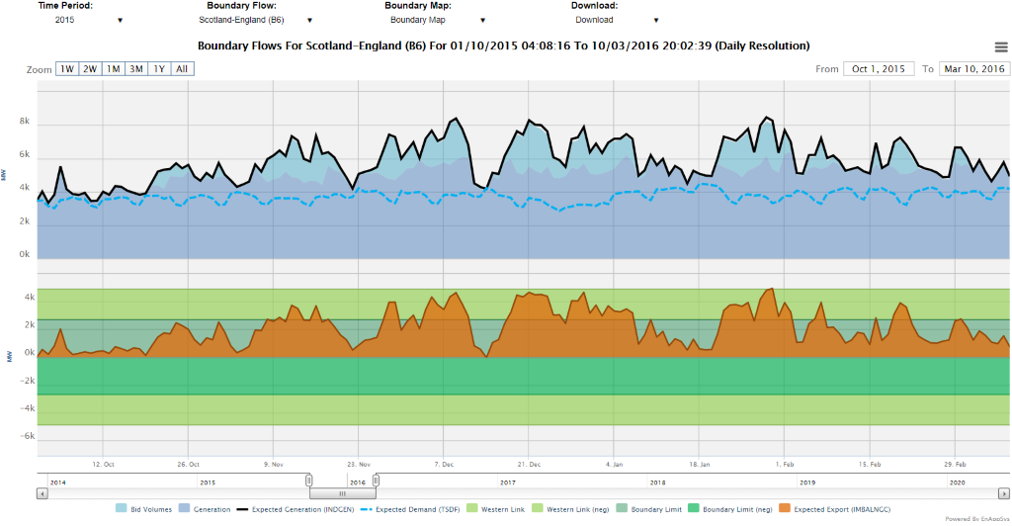
This can be most commonly seen on the England-Scotland border
where too much generation can result in large volumes of bid
actions at Scottish wind farms (sometimes creating negative system
prices):

All these values are based upon forecasts, so could be known
in advance, but when the generation minus the demand exceeds the
boundary limits, bid actions are inevitable in the limiting region.
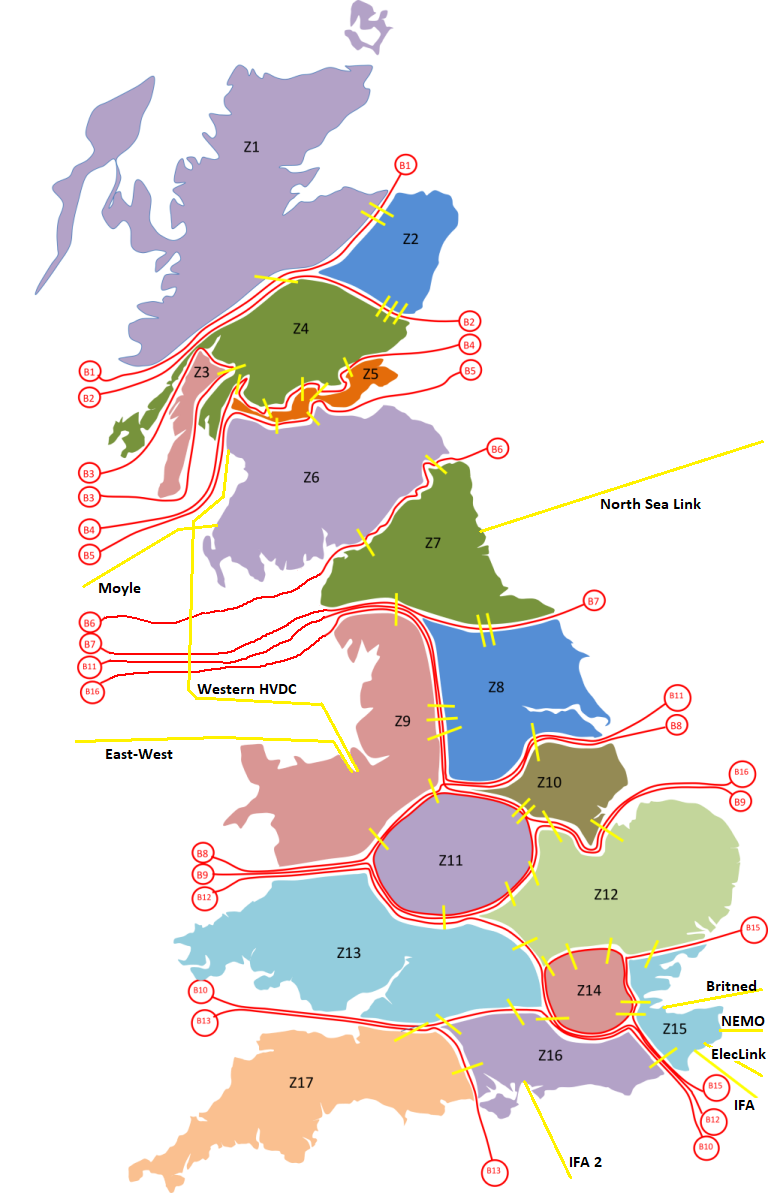
The boundaries can be seen in the following map:

Figure: Map of Boundaries and Zones
Included Data
The data on this chart is as follows:
- Bid Volumes - The levels of bid volume to turn down via the Balancing Mechanism occurring behind the boundary.
- Generation - The levels of post-balancing generation measured behind the the boundary.
- Expected Generation (INDGEN) - The indicated generation forecast (sum of all the PNs submitted for BM Units which are forecast to be exporting energy) behind the the boundary.
- Expected Demand (TSDF) -The transmission system demand forecast (INCLUDES Interconnector flows and demand from station transformers and pumped storage units) behind the the boundary.
- Boundary Limit - the limits of the boundaries with key infrastrucutre split out to aid in the discovery of any outages.
- Expected Export (IMBALNGC) - The Indicated Imbalance forecast (the difference between the sum of the PNs submitted for generation BM Units (i.e. the Indicated Generation), and the Demand Forecast) behind the the boundary.
Data Service
The Boundary Flow Projections data can be extracted from the API. The parameters used are as follows:
| Code |
Required/Optional |
Description |
| chart |
Required |
boundaryflows |
| startdatetime |
Required |
The start date time in format YYYYMMDDHHMMSS. |
| enddatetime |
Required |
The end date time in format YYYYMMDDHHMMSS. |
| resolution |
Required |
The type of resolution. (See 'resolutions' action, e.g.
hh) |
| format |
Required |
The type of format. The value could be xml, csv
or xls. (See 'formats' action)
|
| boundaryflows |
Optional |
The bounday to get data for, defaults to North West Scotland B1. Options are
North West Scotland B1 (1), North-South Scotland B2 (2), Sloy Export B3 (3),
SHTEL-SPT B4 (B4), Central-Southern Scotland B5 (5), Scotland-England B6 (6),
Northern England B7 (7), Midlands North B8 (8), Midlands South B9 (9),
South Coast B10 (10), NE & Yorkshire B11 (11), South & SW (B12),
South Wales & SW England B13 (13), London B14 (14), Thames Estuary B15 (15),
NE, Trent & Yorkshire B16 (16) or W Midlands B17 (17).
|
|
Examples :
https://enbm.netareports.com/dataService?username=xxx&password=xxx&format=xml&action=data&chart=boundaryflows&startdatetime=20190213000000&enddatetime=20190214000000&resolution=hh&boundaryflows=6
|
|

