|
Help Files:
|
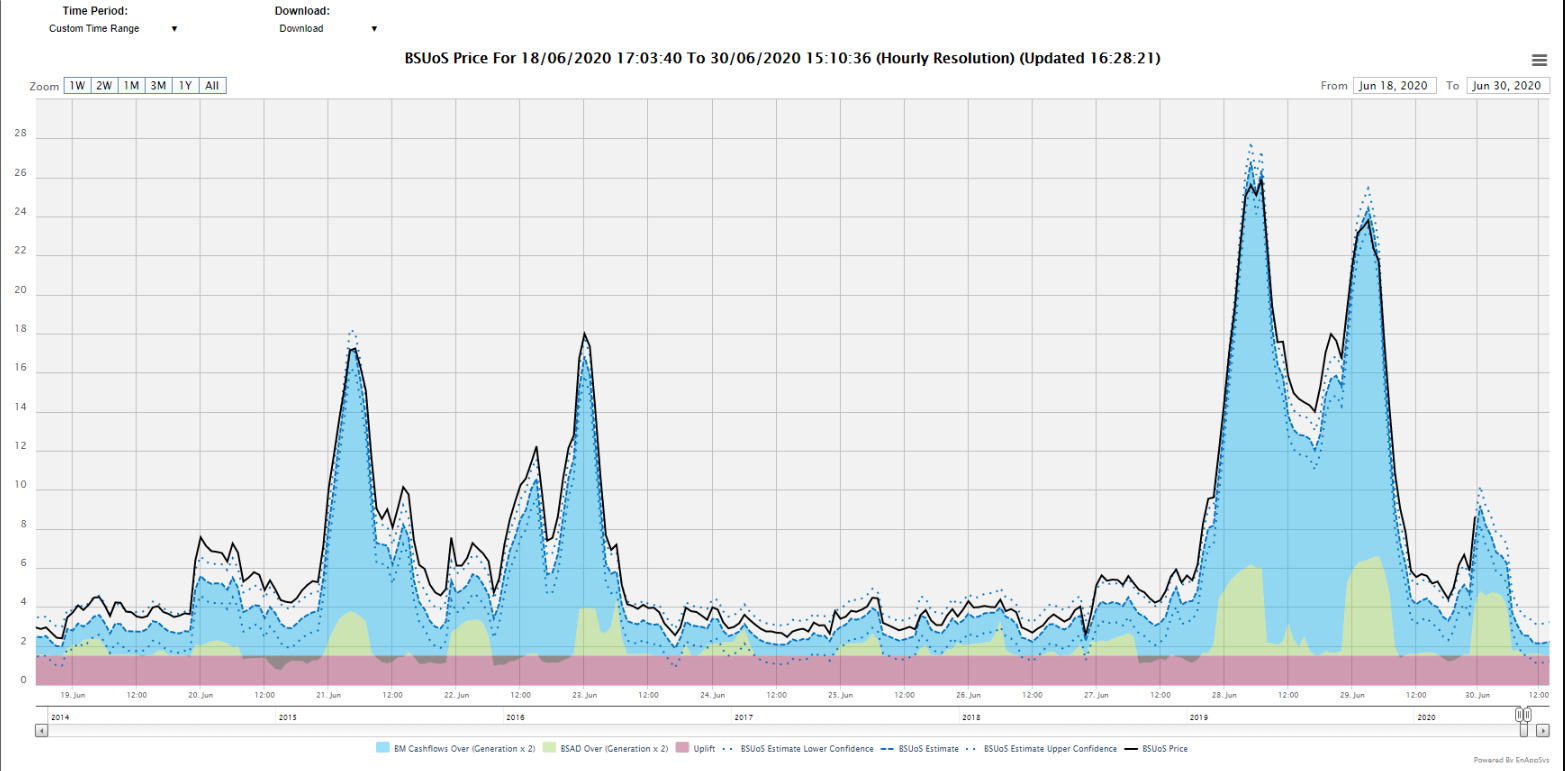
BSUoS PriceAboutThe BSUoS Price chart plots the Balancing Mechanism and BSAD cashflows (Bids and Offers) divided by total generation over two, with an uplift of £1.62/MWh to account for underlying service values. As the uplift value varies a confidence range has been added to allow for variations in this figure. The upper and lower bounds on this figure have been applied by looking at the 99th percentile historically to pick up a normal range of deviation. It may be worth tracking the evolution of this deviation. The following chart shows this plot in a dashed blue line (available as actions come in) versus the outturn price in black against all these other elements:
Data ServiceThe BSUoS Price data can be extracted from the API to extract the outturn BSUoS and the live Balancing Mechanism component of this value. The parameters used as follows:
|
||||||||||||||||||||||
