|
Help Files:
|
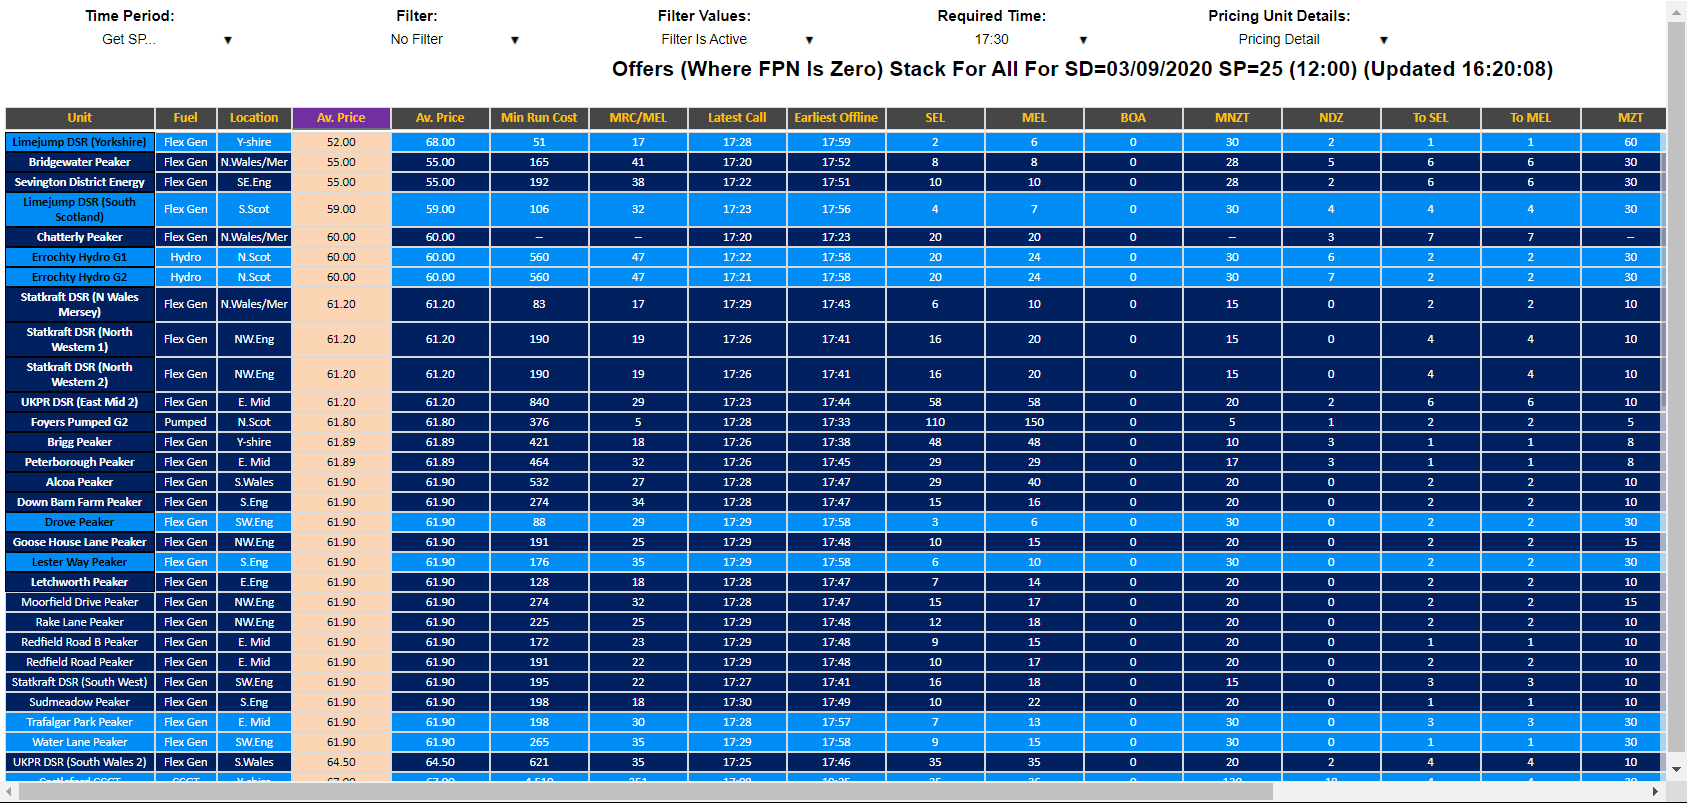
Offer On TableThe Offer On Table is the primary screen that should be used to review how high offer prices (and so potentially system prices) could be if National Grid needs to bring a plant on to fill a gap or to build strategic margin. For this chart the ability to filter is particularly useful and so can be used to both view the plants available to provide capacity above that provided by already online plants (this uplift form online plants can be viewed in the Availability > System Margin Summary chart) within the next 30 minutes. This chart has been filtered to only show plants with an NDZ (Notice to Deviate from Zero) less than 30 minutes and sorted to find the cheapest plants if the gap proves to be very small by sorting by the Minimum Run Cost.
This Minimum Run Cost is the cost of a run to the Stable Export Limit (SEL – minimum level of generation able to be maintained for a prolonged period) and then to zero, with the return to zero coming as soon as is physically possible. This shows the options to National Grid to flexibly manage any brief shortfalls, but on tighter days the focus for National Grid is more about boosting the levels of flexible capacity during an evening peak. This is achieved by holding back plants with short response times, as well as starting up larger and slower plants to run at their Stable Export Limit. This is achieved by backing down existing plants in the market. The effect this has is that where the market had one 500MW unit running at 495MW with 5MW headroom, it could instead have two running at 250MW with a combined 500MW of headroom, whilst only seeing a 5MW increase in net generation; with one being bid down by 245MW and another offered up by 250MW. The list of plants available to perform this service can be seen via the following setup:
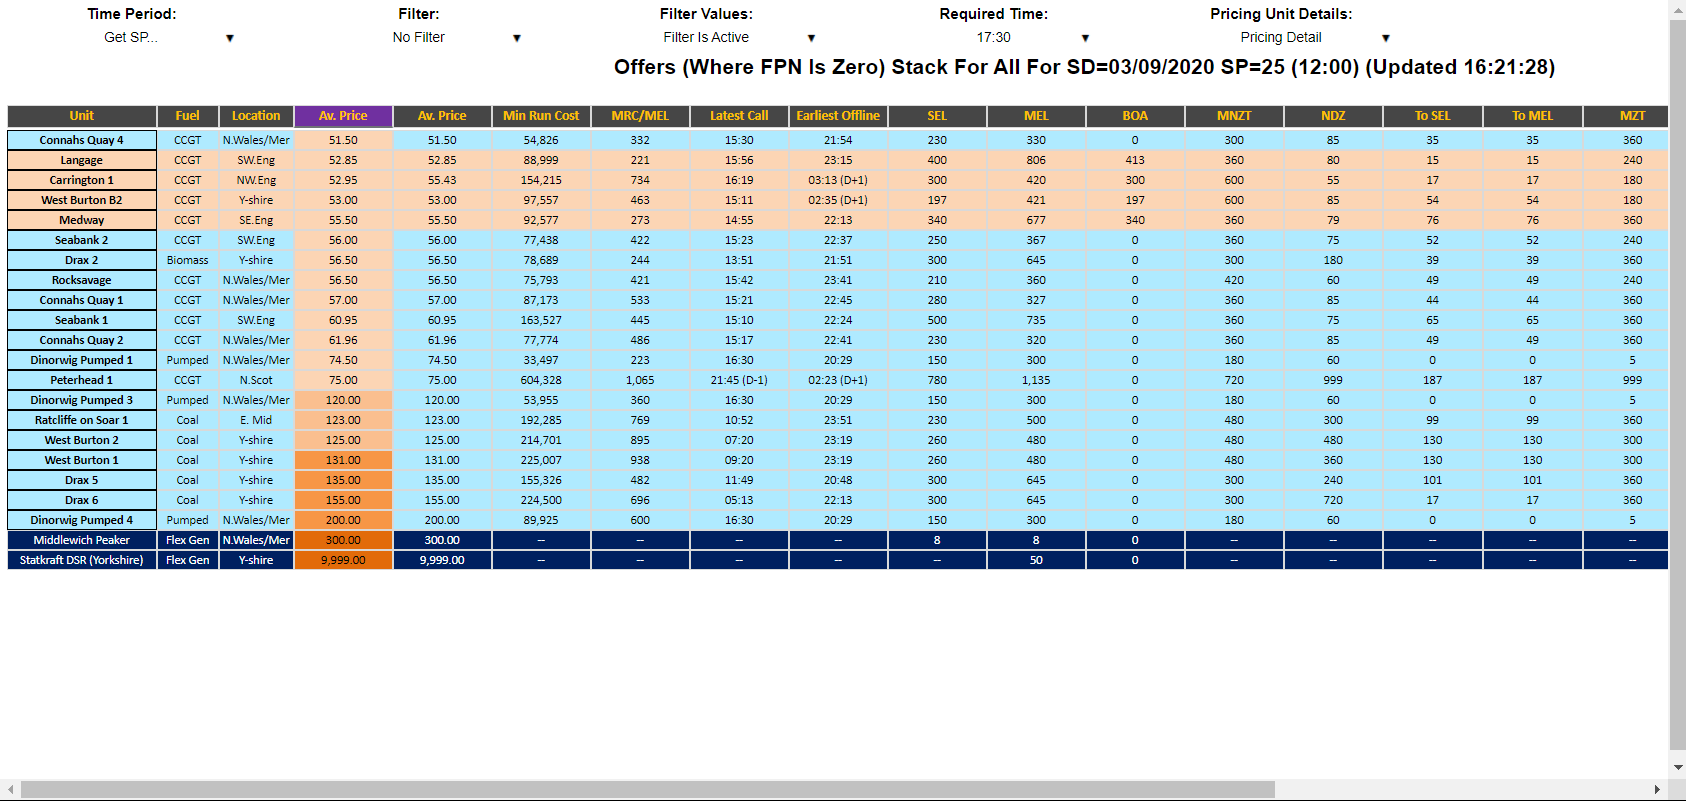
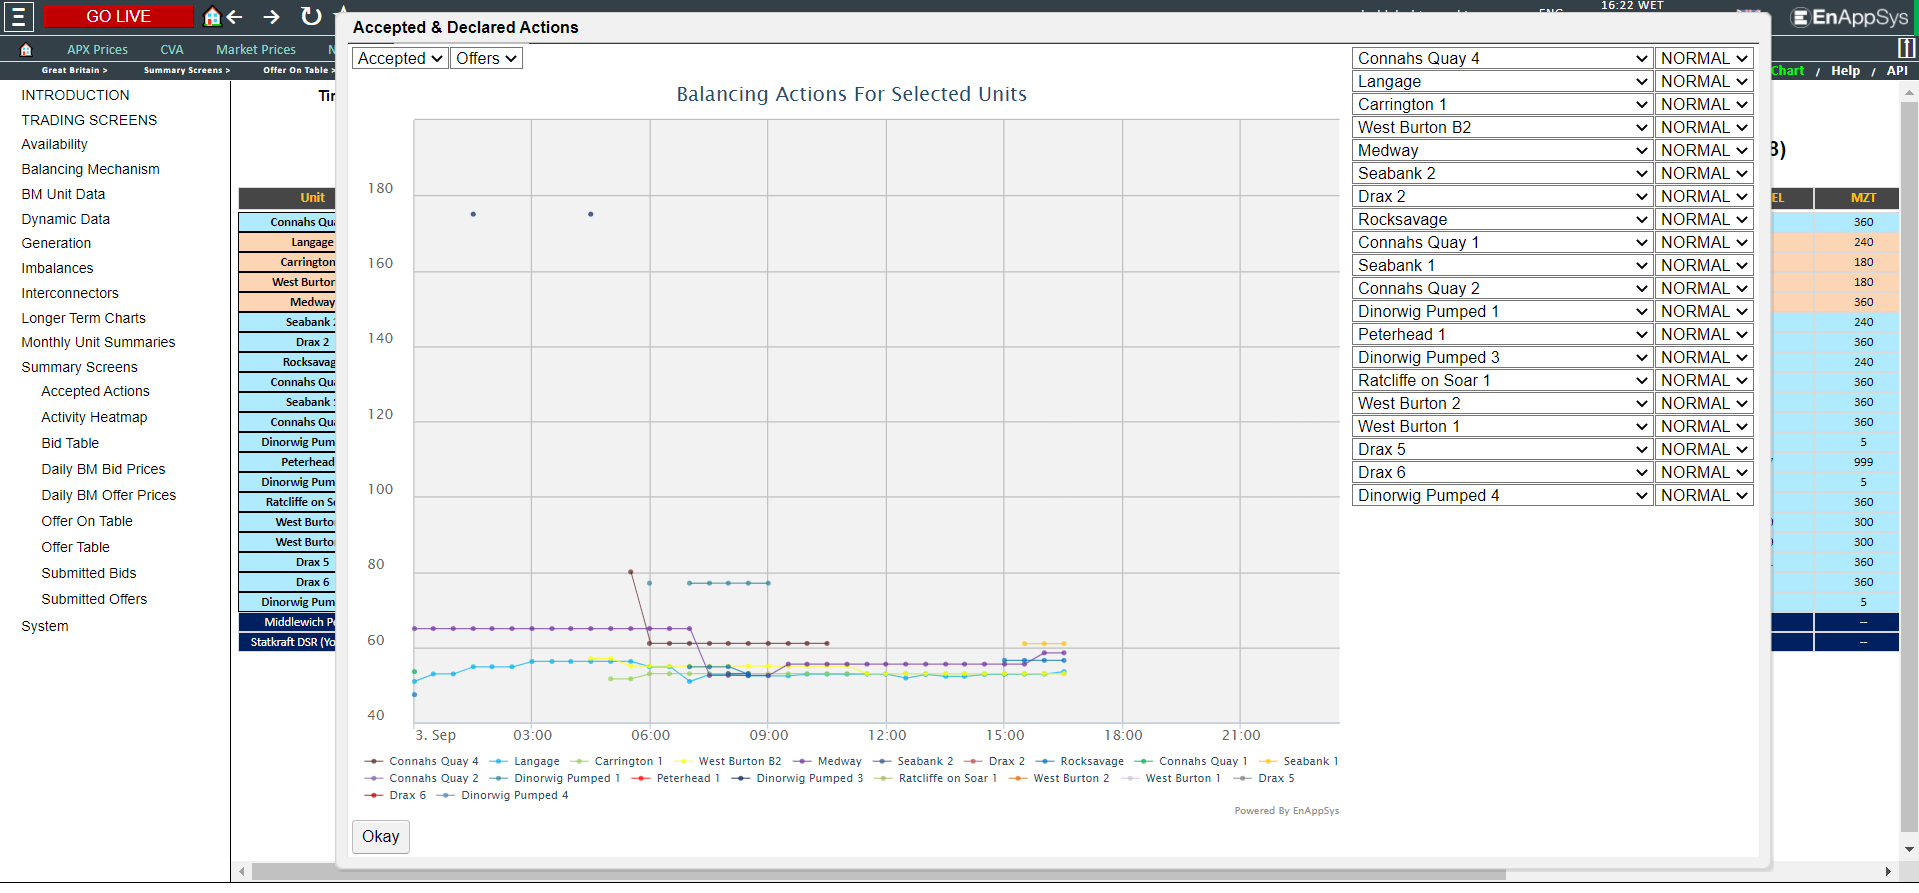
This has been achieved by filtering for an NDZ (Notice to Deviate from Zero) greater than 45 minutes and a MNZT (Minimum Non-Zero Time) also greater than 45 minutes. This shows that National Grid could currently bring on nine plants for up to £60/MWh, suggesting limited high-priced potential beyond the typical pumped storage range of around £110/MWh. With such a long list, generators are effectively being encouraged by market fundamentals to submit low prices, where the list shortens this effect does not apply and so on the tight days, prices on this list can rise into the hundreds or thousands of pounds per MWh. On this chart it is possible to examine the information at the accepted/declared bids/offers at a selected group of units. By default the first 20 units on the table will be selected. Then information about these units can be seen for those selected by using 'Pricing Unit Details' > 'See Declared Offers...'. The selected units can be changed by clicking on the cell containing the unit name without click on the link on the name itself.
Included DataThe data on this chart is as follows:
Note that moving left and right when target time has been chosen by period will move from one settlement period to the next. This will take the average values across the settlement period. Within the settlement period levels of generation will change minute-to-minute and so LIVE and Custom Time allow for the selection of either the current position or the position at a particular time. Colours GuideThe following details the colours used in this chart:
Data ServiceThe Offer On Table data can be extracted from the API. The parameters used as follows:
|
|||||||||||||||||||||||||||||||||||||


