|
Help Files:
|
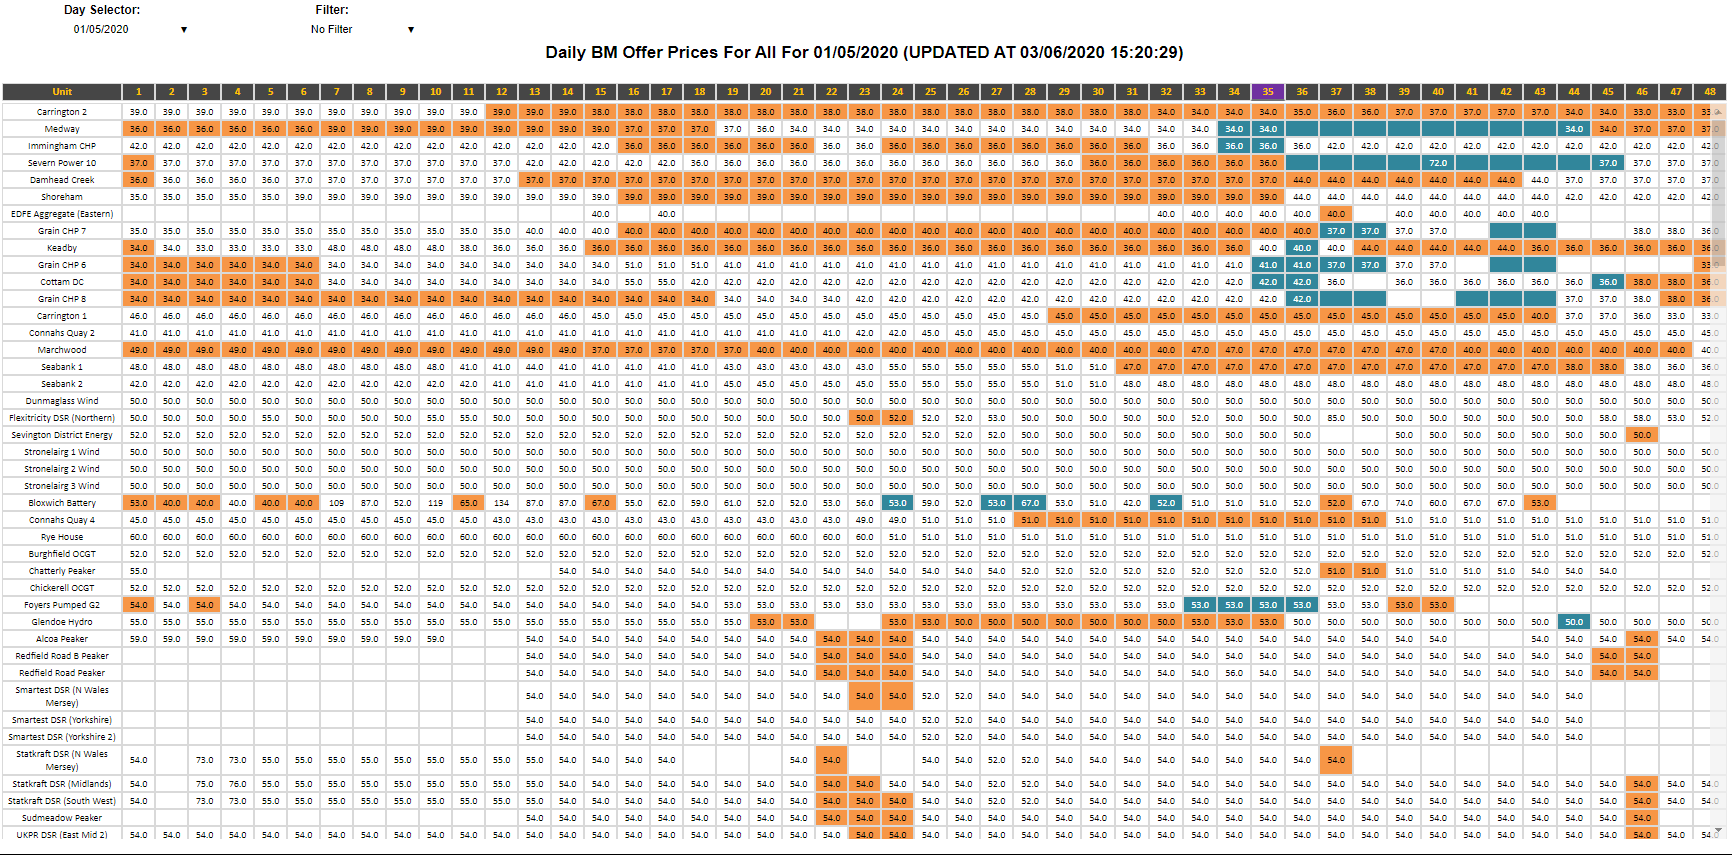
Daily BM Offer PricesAboutThe Daily BM Offer Prices screen shows for a single day a table containing all the declared offer prices (to turn up) for the first pair (i.e. the first 1MWh of upward correction), with accepted offers (energy or system flagged differently) and accepted bids highlighted.
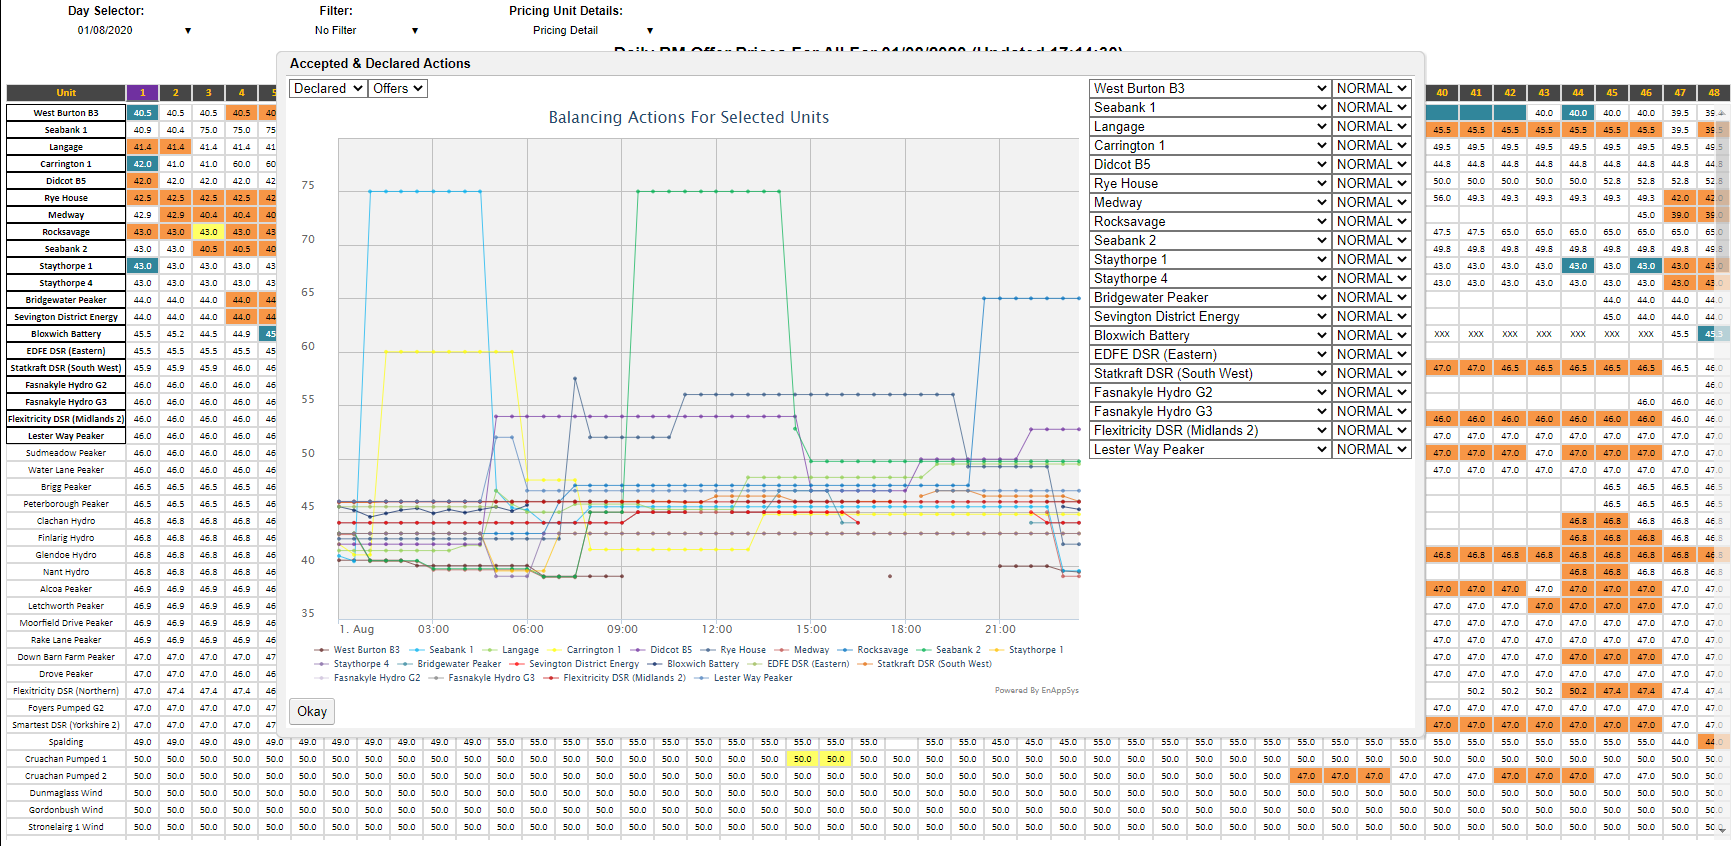
To see more information about a particular unit the user can click on the unit name and this will give an option of viewing the 'BM Unit Operations' and other charts which shows what the unit has been doing. Clicking on the settlement period number at the top will sort the data for that column. On this chart it is possible to examine the information at the accepted/declared bids/offers at a selected group of units. By default the first 20 units on the table will be selected. Then information about these units can be seen for those selected by using 'Pricing Unit Details' > 'See Declared Offers...'. The selected units can be changed by clicking on the cell containing the unit name without click on the link on the name itself.
Included DataThe values on this chart are the first declared Offer Price, which are the prices for the first MWh of potential offer volumes. These prices are not shown where there is no difference between the FPN (levels of planned generation ahead of gate closure and typically matching the volumes sold in traded markets) and the Max Export Limit (maximum level at which the BM Unit may be exporting to the GB Transmission System at the Grid Supply Point). Where prices are greater than £9000/MWh the values have been replaced with XXX to indicate a very extreme price (in order to reduce the number of large value affecting column widths). Additionally the values are at 1dp (or 0dp when £100/MWh or more) to compress the width of the cell entries to fit all 48 periods on a wide screen. Colours GuideThe following details the colours used in this chart:
Data ServiceThe Daily BM Offer Prices data can be extracted from the API. The parameters used as follows:
|
||||||||||||||||||||||||||

