|
Help Files:
|
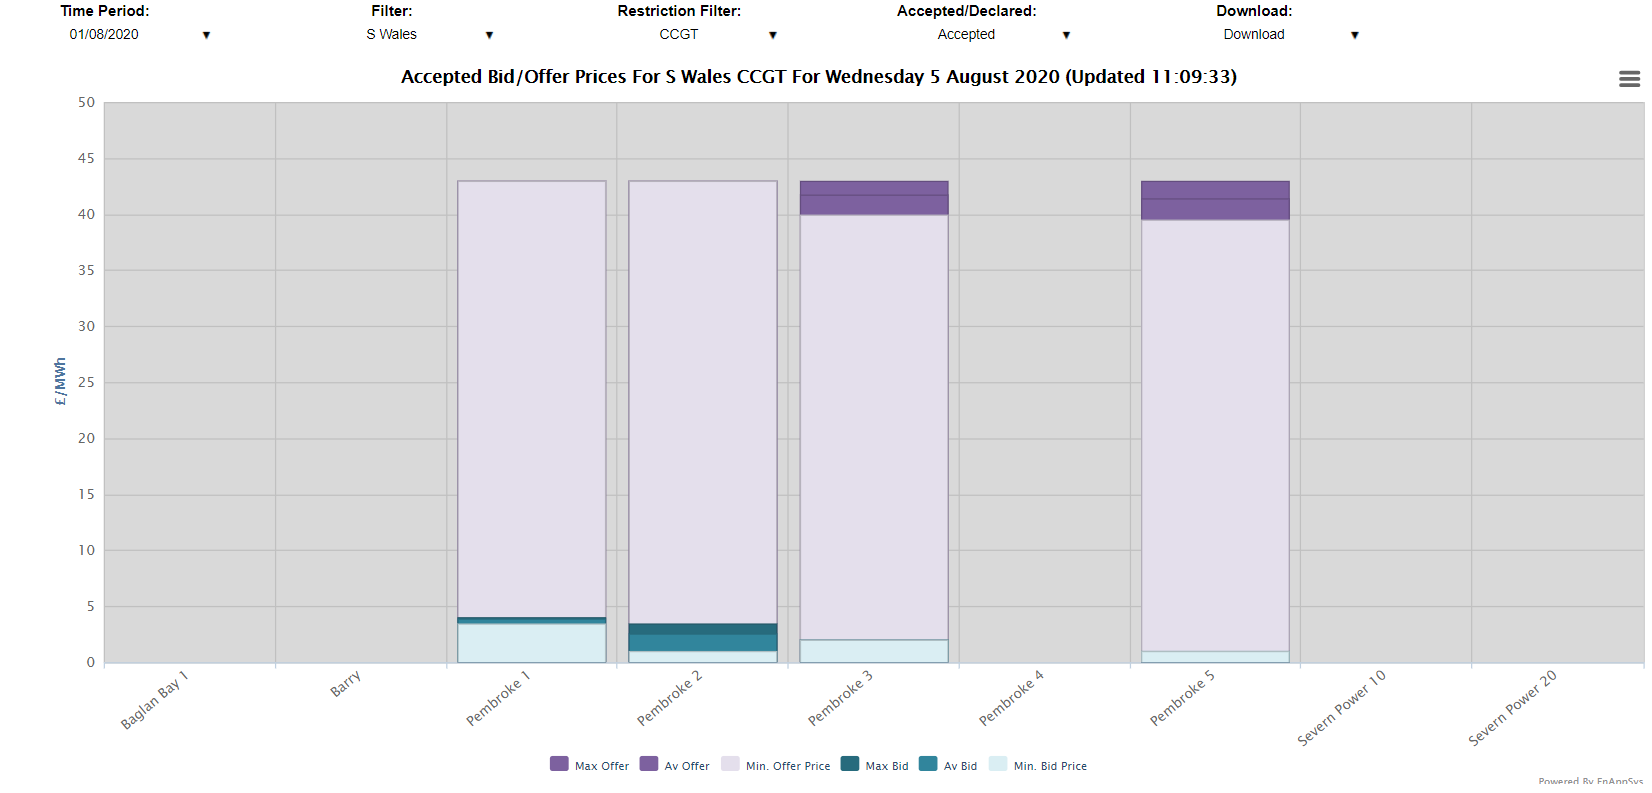
Bid/Offer Prices ChartAboutThe Bid/Offer Prices chart shows the min, average and max bid and offer prices for a units over a period of time. This is most useful when looking over a period of a week, but the following chart is focused in on prices for CCGTs in South Wales over a single day:
This chart at its highest levels provides a summary of each of the filter groups, with the minimum and maximum reverting to the minimum and maximum average offer prices so as to not being too heavily weighted towards outliers. From here the columns can be clicked on to drill through and then if a unit’s column is clicked on it can be used to show the activity of the unit over time in more detail or an additional filter can be applied (as in the example). Included DataThe data on this chart is the Accepted (or Declared) Bid/Offer Price data, which represents the price in £/MWh of any actions taken (or available to be taken) by National Grid to reduce/increase generation via the Balancing Mechanism within gate-closure. Data ServiceThe Bid Offer Prices data can be extracted from the API to get the minimum, average and maximum bid and offer prices by unit within a grouping over a period of time. The parameters used as follows:
|
|||||||||||||||||||||||||
