|
Help Files:
|
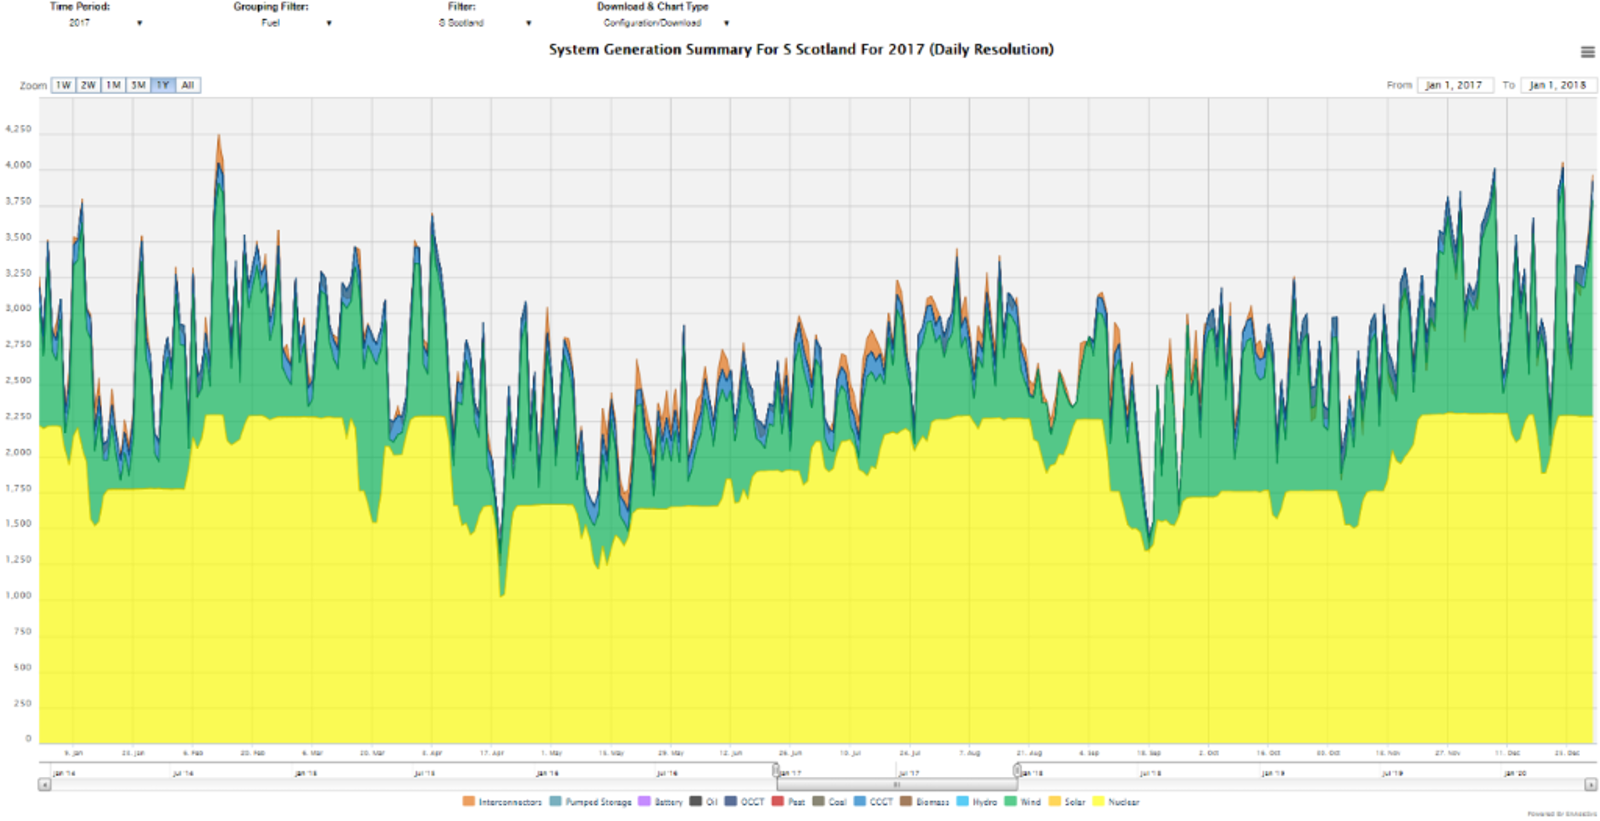
System GenerationAboutThe System Generation Summary chart plots for a given filter levels of generation broken down by the given Grouping Filter. For instance, the following chart shows the evolution of the southern Scottish fuel mix in 2017:
Included DataThe generation measure used is the minimum of the Max Export Limit (the maximum level at which the BM Unit may be exporting to the GB Transmission System at the Grid Supply Point) and the balancing adjusted generation (levels of post-balancing generation after National Grid has adjusted generation within gate closure). Note this uses generation by unit data so the values will be different to the fuel mix data. Data ServiceThe System Generation Summary data can be extracted from the API to get levels of aggregated generation based upon a set of tags that can be extracted from the browser URL of the System Generation Summary chart during normal viewing. The parameters used as follows:
|
||||||||||||||||||||||||||||