|
Help Files:
|
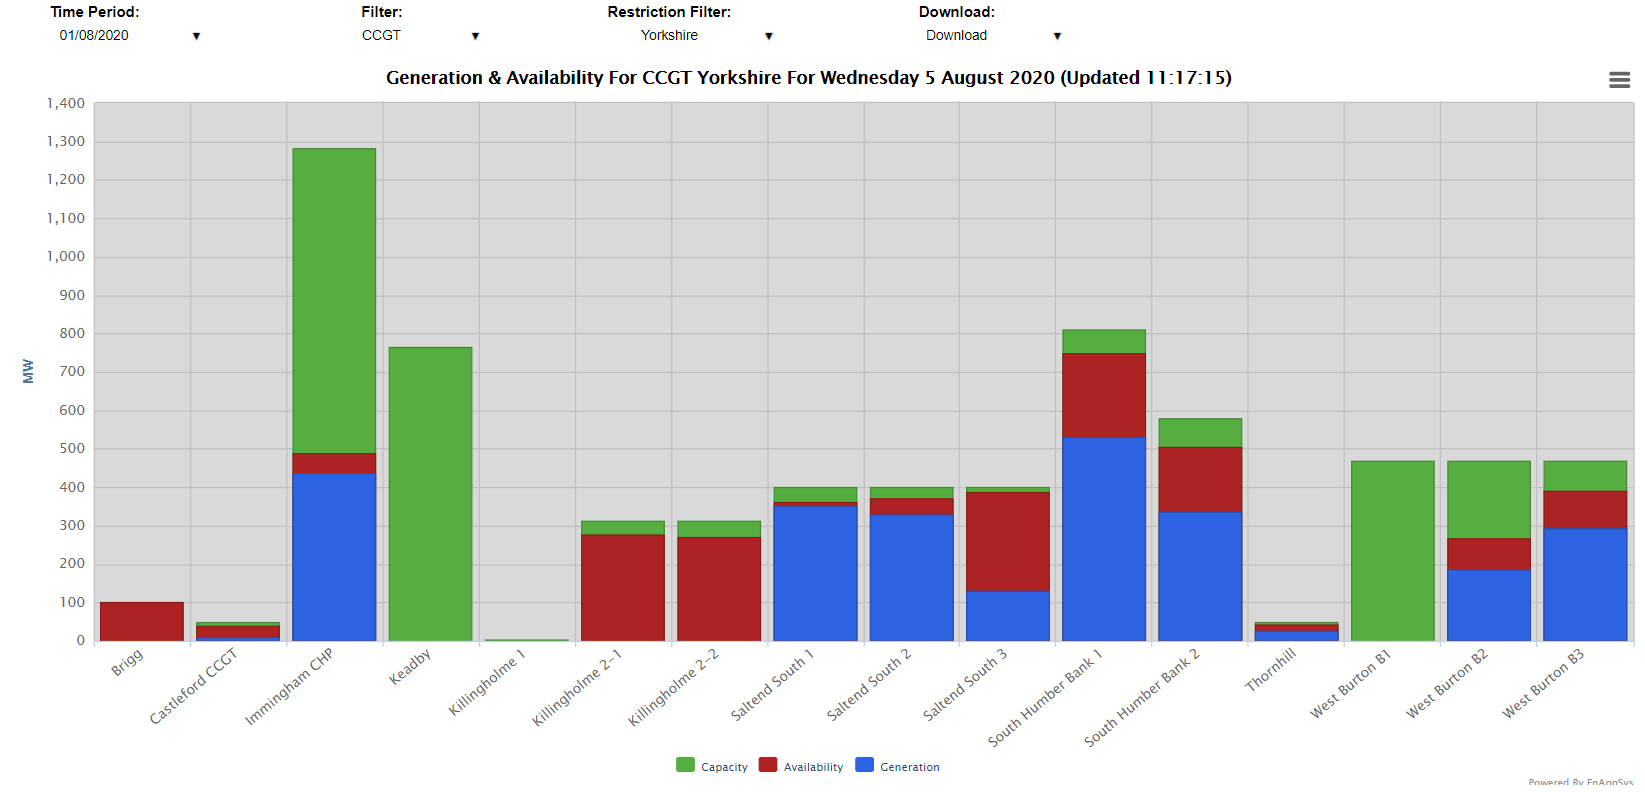
Generation & AvailabilityAboutThe Generation & Availability chart is a simple chart that shows levels of installed capacity, availability and generation for groups of units across the market over a defined period of time. For instance the following screen shows a summary of activity from CCGTs in Yorkshire:
The plants with high levels of blue show baseload operation, whilst the plants only showing green are unavailable and offline. Where a unit is completely shown in red, availability but no generation is indicated. A mix of blue and red shows plants that are available and generating for a portion of their available hours. Filtering for Fuel and All and then you would get average levels of capacity, availability and generation across each of the filter types. Then if activity at one particular fuel type was of interest you could drilldown into that filter by selecting the series representing that filter and pressing 'Drilldown' when a popup box asks if you would like to see that filter in greater detail. That would then show levels of capacity, availability and generation by unit across that filter and you could then click on one unit to get the option to go view that units BM Unit Operations chart. Included DataThe data on this chart is as follows:
Data ServiceThe Generation & Availability data can be extracted from the API to get the capacity, availability and generation by unit within a grouping over a period of time. The parameters used as follows:
|
||||||||||||||||||||||