By Country Import/Export
About
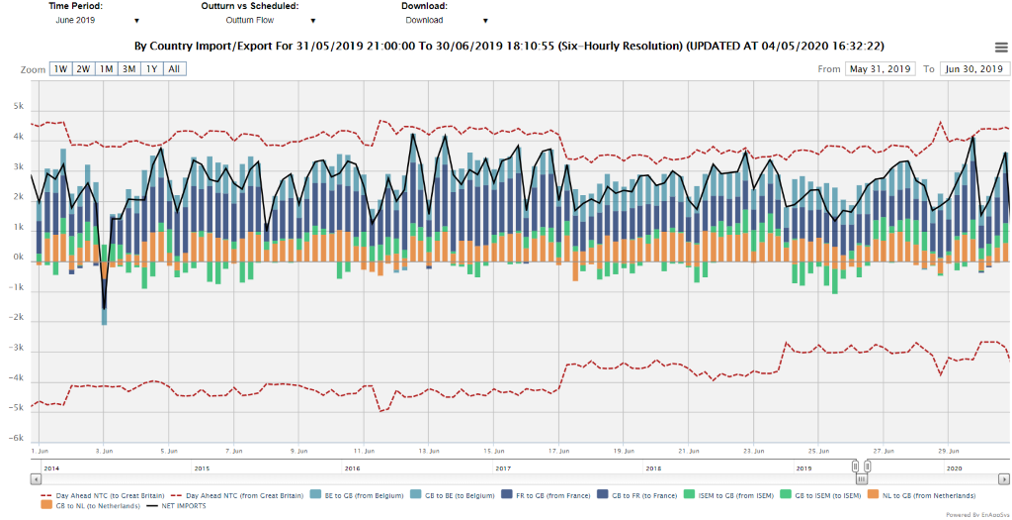
This chart shows actual and planned levels of flow in and out of Great Britain to and from neighbouring regions. Positive numbers show imports while numbers below 0 show exports.
The following example shows GB’s imports and exports in June 2019. Most of the time GB has been a net importer – except on the 3rd June 2019. On this day, GB exported to the Netherlands, to Belgium and to France.
The dropdown allows for the selection between measured, scheduled and day ahead scheduled imports and exports.

Included Data
The data on this chart is as follows:
- Day Ahead NTC - The position (and negative) transfer capacity as declared at the day ahead nomination point.
- A to B (from/to xxx) - The levels of measured/scheduled/day ahead scheduled flow from/to a neighbouring market.
- NET IMPORTS - The sum of the imports across all countries.
Data Service
The By Country Import/Export data can be extracted from the API. The parameters used are as follows:
| Code |
Required/Optional |
Description |
| chart |
Required |
bycountry |
| startdatetime |
Required |
The start date time in format YYYYMMDDHHMMSS. |
| enddatetime |
Required |
The end date time in format YYYYMMDDHHMMSS. |
| resolution |
Required |
The type of resolution. (See 'resolutions' action, e.g.
hh) |
| format |
Required |
The type of format. The value could be xml or csv
. (See 'formats' action)
|
| outturnsched |
Optional |
Defaults to 0 (outturn data). Other options are 1 (scheduled) and 2 (scheduled da) |
|
Examples :
https://enbm.netareports.com/dataService?username=xxx&password=xxx&format=xml&action=data&chart=bycountry&startdatetime=20190213000000&enddatetime=20190214000000&resolution=hh&outturnsched=0
|
|
