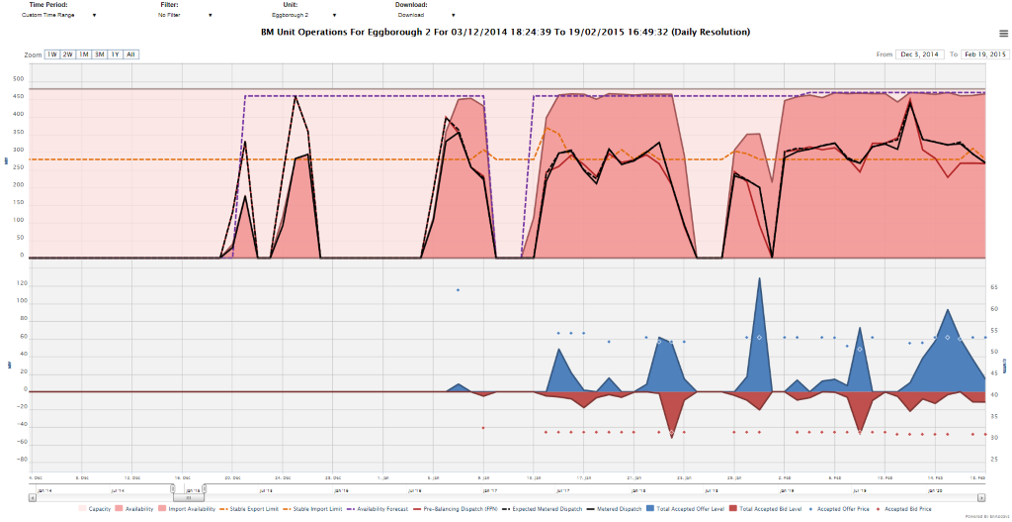
BM Unit Operations
About
The BM Unit Operations chart is one of the most useful charts
in the Historical Market Summary package as it shows the activity
as a single or at a group of units in the market over time. This
can be used to both see long-term behaviour at a unit or to see
particular activity over a given day, week or month.
This includes the levels of availability and generation at a
particular unit, along with a summary of the balancing volumes and
prices that have been achieved.
This can for instance be seen for Eggborough unit 2 over
time, showing how the unit has gone from baseload generation in
early 2014, through an outage in summer 2014, through to mostly
baseload operation in winter 2014/15, to another outage in summer
2015, to reduced operation in winter 2015/16 and then to only
operating in the market via SBR in winter 2016/17.
It is then possible to zoom in on particular activity of
interest:

Zooming in on this period, shows where the plant failed to
meet planned levels of generation as it returned from its summer
outage:

This chart is linked to from across this application and this
by unit information forms the primary building blocks of the entire
application.
Note on this chart that pressing up or down on the keyboard
will cycle through the units included.
The series shown depend on the user’s permission levels as
only users with permissions to see metered volume data will see
this series.
Included Data
The data on this chart is as follows:
- Capacity - The nameplate capacity of the unit - ie if at 100% availability.
- Availability - Levels of real
time availability as noted by Max Export Limit availability data
(the maximum level at which the BM Unit may be exporting to the
GB Transmission System at the Grid Supply Point), with units having an obligation to re-declare
their Max Export Limit (MEL) whenever their availability reduces
(for instance after a failed start). Where MEL is below expected
metered volume a unit has an indicated imbalance.
- Import Availability - The Max Import Limit (MIL) which is the levels of declared import
capability at units such as batteries or pumped storage.
- Stable Export Limit - The minimum stable export operating level for BM Unit, ie the point below
which a unit cannot go without turning off.
- Stable Import Limit - The minimum stable import operating level for BM Unit, ie the point above
which an importing unit cannot go without stopping importing or beginning export.
- Availability Forecast - The 2-14 Day Unit Output Usable OC2 availability data
(the maximum expected daily availability). For wind farms this is a forecasted output value.
- Pre-Balancing Dispatch (FPN) - The levels of planned generation ahead of gate closure and typically matching
the volumes sold in traded markets.
- Expected Metered Dispatch - The levels of post-balancing generation after National Grid has adjusted generation
within gate closure.
- Metered Volume - On a 5-working-day behind basis users who
have permissions that allow access to metered volume data will see
operationally metered values that are a measurement of levels of
generation recorded as being generation at a unit.
- Total Accepted Offer Volume - The total accepted
offer volume is the total volume by which a unit has had its
levels of generation increased via the Balancing Mechanism.
- Total Accepted Bid Volume - The total accepted bid
volume is the total volume by which a unit has had its levels of
generation decreased via the Balancing Mechanism.
- System Offer Volume - The system
offer volume is the system flagged volume by which a unit has had its
levels of generation increased via the Balancing Mechanism, ie the volume
of actions issues for non-Energy reasons (e.g. due to a transmission
constraint).
- System Bid Volume - The system
bid volume is the system flagged volume by which a unit has had its
levels of generation decreased via the Balancing Mechanism, ie the volume
of actions issues for non-Energy reasons (e.g. due to a transmission
constraint).
- Accepted Offer Price - The accepted offer price is
the average price at which a unit has had its levels of generation
increased via the Balancing Mechanism.
- Accepted Bid Price - The accepted bid price is the
average price at which a unit has had its levels of generation
decreased via the Balancing Mechanism.
On the Britned, French, Nemo and aggregate interconnector charts,
the scheduled levels of imports are also indicated, which adds the following two series:
- Scheduled Imports DA - The nominated flows excluding within day trades.
- Scheduled Imports - The nominated flows including within day trades.
Data Service
The BM Unit Operations data can be extracted from the API to
get the key unit operations data such as generation and Balancing
Mechanism activity over time. The parameters used as follows:
| Code |
Required/Optional |
Description |
| chart |
Required |
bmops |
| startdatetime |
Required |
The start date time in format YYYYMMDDHHMMSS. |
| enddatetime |
Required |
The end date time in format YYYYMMDDHHMMSS. |
| resolution |
Required |
The type of resolution. (See 'resolutions' action, e.g.
hh) |
| filter |
Optional |
The group to show data for, e.g. filter=fuel&fuel=coal.
This defaults to no filter and is as in the browser URL when
picking options in the chart normally.
|
| bmunitid |
Optional |
The is the unit id and can be found in the Browser URL.
For instance bmunitid=T_ABTH7.
|
| format |
Required |
The type of format. The value could be xml or csv
. (See 'formats' action)
|
|
Example :
https://enbm.netareports.com/dataService?username=xxx&password=xxx&format=xml&action=data&chart=bmops&startdatetime=20190520000000&enddatetime=20190527000000&resolution=hh&filter=none&none=null&bmunitid=T_ABTH7
|
|

