|
Help Files:
|
Unit Generation & Availability
About
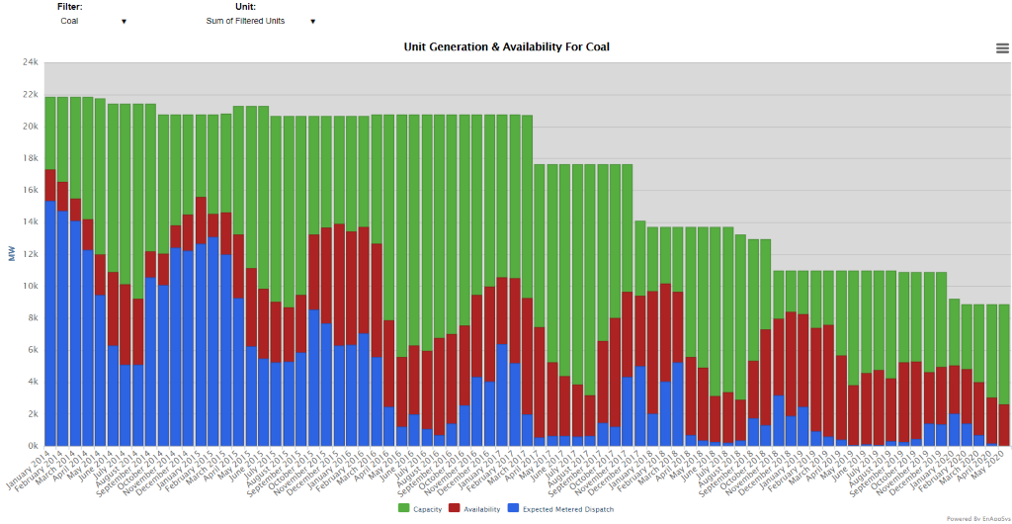
The Unit Generation & Availability chart replicates the Unit Bid/Offer Prices chart, but plotting levels of installed capacity, availability and generation for a given unit or filter group. For instance, the following chart shows the evolving levels of activity at coal-fired power stations in the market over time:
Included Data
The data on this chart is as follows:
- Capacity - The nameplate capacity of the unit - ie if at 100% availability.
- Availability - Levels of real
time availability as noted by Max Export Limit availability data
(the maximum level at which the BM Unit may be exporting to the
GB Transmission System at the Grid Supply Point), with units having an obligation to re-declare
their Max Export Limit (MEL) whenever their availability reduces
(for instance after a failed start). Where MEL is below expected
metered volume a unit has an indicated imbalance.
- Generation - The levels of post-balancing generation after National Grid has adjusted generation
within gate closure.
Data Service
The Unit Generation & Availability data can be extracted from
the API to extract on a monthly basis the volumes for capacity,
availability and generation. The parameters used as follows:
| Code |
Required/Optional |
Description |
| chart |
Required |
unitsgaa |
| filter |
Optional |
The group to show data for, e.g. filter=fuel&fuel=coal.
This defaults to no filter and is as in the browser URL when
picking options in the chart normally.
|
| bmunitid |
Optional |
The is the unit id and can be found in the Browser URL.
For instance bmunitid=T_ABTH7.
|
| format |
Required |
The type of format. The value could be xml or csv
. (See 'formats' action)
|
|
Examples :
https://enbm.netareports.com/dataService?username=xxx&password=xxx&format=xml&action=data&chart=unitsgaa&filter=fuel&fuel=all&bmunitid=T_ABTH7&accdecl=0
|
|