|
Help Files:
|
Dynamic Data Changes
About
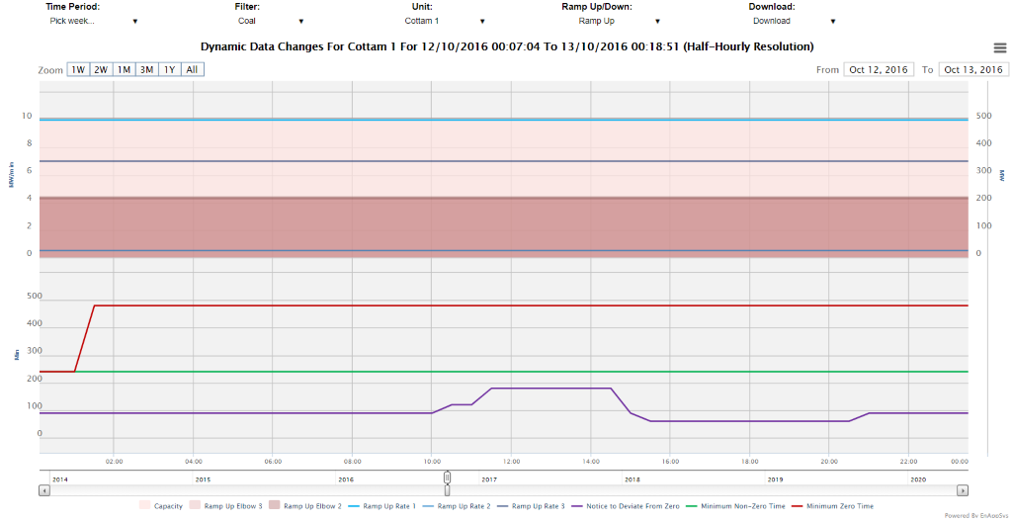
The Dynamic Data Changes chart shows the changes in dynamic
parameters at units in the market. For instance the following chart
shows the dynamic data for Cottam 1 on the same day it achieved
£800/MWh. This shows that having been running the previous day, the
unit saw a Notice to Deviate from Zero climb to 180 minutes by
midday and then come down as the unit was warmed via a Sonar action
ahead of its run in the afternoon:

Included Data
The data on this chart is as follows:
- Capacity - The nameplate capacity of the unit - ie if at 100% availability.
- Ramp Up (or Down) Elbow 3 - The MW level above which Ramp Up (or Down) rate 3 applies.
- Ramp Up (or Down) Elbow 2 - The MW level above which Ramp Up (or Down) rate 2 applies.
- Ramp Up (or Down) Rate 1 - The MW/min speed of response from 0 to Ramp Up (or Down) Elbow 1.
- Ramp Up (or Down) Rate 2 - The MW/min speed of response from Ramp Up (or Down) Elbow 2 to Ramp Up (or Down) Elbow 3.
- Ramp Up (or Down) Rate 3 - The MW/min speed of response from Ramp Up (or Down) Elbow 3 to Capacity.
- Notice to Deviate From Zero - The minutes it takes from getting an instruction to start to being able to
deliver a power output greater than zero.
- Minimum Non-Zero Time - The minutes it takes from climbing abovezero stating a run until the point at which the unit will once again
be able to turn off again, ie how long it must at minimum run for before turning off.
- Minimum Zero Time - The minutes it takes from reaching zero after a run until the point at which the unit will once again
be able to produce a power output greater than zero, ie how long it must remain offline for between runs.
Data Service
The BM Unit Dynamic Profile data can be extracted from the
API to get the dynamic data declared for a single unit in the
market over time. The parameters used as follows:
| Code |
Required/Optional |
Description |
| chart |
Required |
dynamicdatachanges |
| startdatetime |
Required |
The start date time in format YYYYMMDDHHMMSS. |
| enddatetime |
Required |
The end date time in format YYYYMMDDHHMMSS. |
| resolution |
Required |
The type of resolution. (See 'resolutions' action, e.g.
hh) |
| filter |
Optional |
The group to show data for, e.g. filter=fuel&fuel=coal.
This defaults to no filter and is as in the browser URL when
picking options in the chart normally.
|
| bmunitid |
Optional |
The is the unit id and can be found in the Browser URL.
For instance bmunitid=T_ABTH7.
|
| rampupdown |
Optional |
Indicates whether to show data for ramp up (0) or ramp
down (1). Defaults to rampupdown=0.
|
| format |
Required |
The type of format. The value could be xml or csv
. (See 'formats' action)
|
|
Example :
https://enbm.netareports.com/dataService?username=xxx&password=xxx&format=xml&action=data&chart=dynamicdatachanges&startdatetime=20190520000000&enddatetime=20190527000000&resolution=hh&filter=none&none=null&bmunitid=T_ABTH7&rampupdown=1
|
|